Internal Rate of Return (IRR) – annual rate of return an owner receives from his or her investment, averaged over the life of investment. IRR is calculated on the basis of market value of equity share in the business. It reflects total return to the owner from both the growth in equity value and dividends received.
Why IRR is important for business owners:
IRR is best used in:
For a business owner,
How can an owner practically apply IRR calculation in a strategic decision-making process – to develop or to sell the business?
| Period | 0 | 1 | 2 | 3 | 4 | 5 |
|---|---|---|---|---|---|---|
| Equity Value | 10,0 | 12,0 | ||||
| Dividends | 1,0 | 1,0 | 1,0 | 1,0 | ||
| Shareholder Cash Flows (CF) | (10,0) | 1,0 | 1,0 | 1,0 | 1,0 | 12,0 |
| IRR | 11,6% | |||||
| Formula in MS Excel | = IRR (Shareholder CF) | |||||
where:
EqV0 – Equity Value at the beginning of the period;
EqVn – Equity Value at the end of the period;
y - Year number of ownership;
n - Total number of years of ownership (in case above – 5 years);
Dividends – Dividends received by the business owner in year y.
Consider an entrepreneur who owns a growing business. The company’s market is becoming saturated, competition is increasing, and it is expected that within the next five years the business will reach maturity and slow down – entering a plateau.
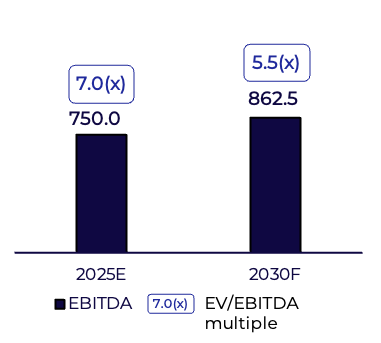
Assume that due to current market growth potential, the company is valued at 7.0x EV/EBITDA in 2025, or ₽3.8 b, based on an estimated EBITDA of ₽750 m in 2025 and net debt of ₽ 1.5 b.
In 2025, the business owner needs to choose between two options:
At first glance (see the table below), given the company’s growth, holding and selling the company in the future (2030) may appear to be justified.
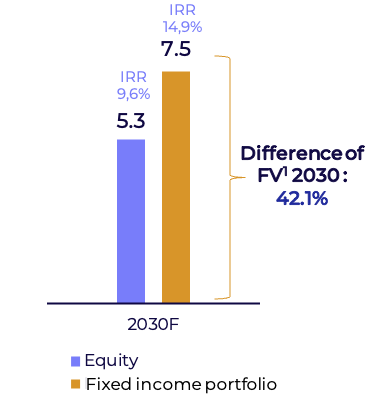
However, Option 2 – selling the business in 2025 – may actually be the preferable, even though the company’s financial metrics in 2030 are higher than in 2025.
| Criteria | Option 1 | Option 2 |
|---|---|---|
| Company business risks | Present until 2030 | No, the company is sold |
| Shareholder IRR (forward-looking until 2030) | 9,6% | 14,9% |
| Capital growth compared to the other option | Lower | Higher |
| Asset diversification | None | Capital diversified |
The business owner must take into account not only EBITDA, but also:
IRR helps determine whether it is more profitable to continue owning the business and earning income, or to sell it and invest in assets with higher expected returns.
| Year | 2025E | 2026F | 2027F | 2028F | 2029F | 2030F | CAGR 2025-2030 |
|---|---|---|---|---|---|---|---|
| Period | 0 | 1 | 2 | 3 | 4 | 5 | |
| Revenues | 5 000,0 | 5 750,0 | 6 612,5 | 7 273,8 | 8 001,1 | 8 401,2 | 10,9% |
| Growth rate | - | 15,0% | 15,0% | 10,0% | 10,0% | 5,0% | - |
| EBITDA[1] | 750,0 | 862,5 | 991,9 | 1 054,7 | 1 160,2 | 1 176,2 | 9,4% |
| EBITDA margin | 15,0% | 15,0% | 15,0% | 14,5% | 14,5% | 14,0% | - |
| Net profit | 250,0 | 287,5 | 297,6 | 327,3 | 360,1 | 378,1 | 8,6% |
| NP margin, % | 5,0% | 5,0% | 4,5% | 4,5% | 4,5% | 4,0% | - |
| Payout ratio, %[2] | 0,0% | 40,0% | 40,0% | 40,0% | 40,0% | 0,0% | - |
| Net Debt | 1 500,0 | 1 725,0 | 1 983,8 | 2 109,4 | 2 320,3 | 1 176,2 | -4,7% | Net Debt / EBITDA | 2,0(x) | 2,0(x) | 2,0(x) | 2,0(x) | 2,0(x) | 1,0(x) | - |
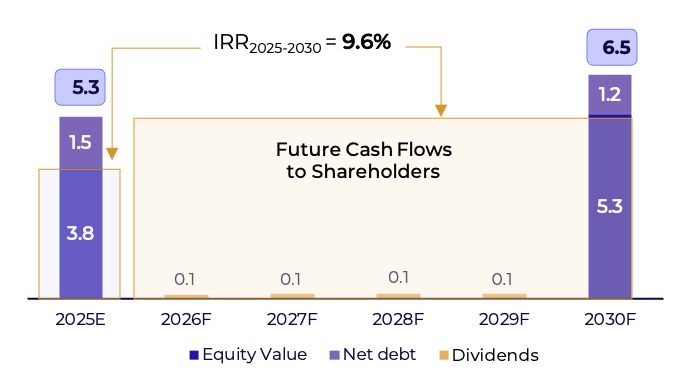
When selling the company in 2030 (holding period – 5 years) at a 7.0(x) EV/EBITDA multiple, its equity value is expected to reach ₽3.8 b. Taking into account the assumed dividend payout ratio of 40% in 2026–2029, the forward-looking IRR will be 9.6%.
To make an informed decision, the business owner should compare this scenario with the alternative – selling the company in 2025 and investing the proceeds in a diversified bond portfolio.
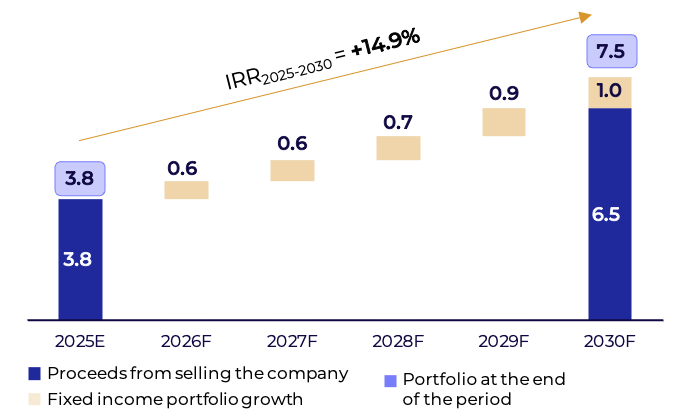
In this scenario, the business owner sells the company in 2025 (period 0) at a 7.0(x) EV/EBITDA multiple, or ₽3.8 b for 100% of the Equity.
The proceeds from the sale are invested in a diversified portfolio of securities, including high-quality corporate and government bonds, ETFs, and other reliable fixed income assets. For simplicity, we will consider a portfolio composed of AAA-rated corporate bonds, in which the owner invests over a five-year horizon.
The assumption is made that the funds are invested in bonds with coupon income reinvested over the five-year period. Under these conditions, the investment portfolio delivers an IRR of
Key assumptions of the fixed income portfolio (simplified approach):


Disclaimer
The information contained in this material is provided by INK ADVISORY Limited Liability Company (abbreviated legal name: LLC INK ADVISORY), OGRN 1247700655180, hereinafter referred to as ink Advisory and/or the Copyright Holder, including research results, forecasts, and fundamental analysis data, and does not constitute an individual investment recommendation.
The information herein should not be construed as a guarantee or promise of future investment returns, risk levels, cost amounts, or investment break-even. Past investment performance is not indicative of future results. This material is provided for informational purposes only and does not contain investment ideas, advice, recommendations, or offers to buy or sell financial instruments (including securities, other assets, or digital financial instruments).
The data presented is for reference purposes only and should not be regarded as a guarantee of income. Examples of investment performance are based on statistics for specific periods and do not reflect the dynamics of future returns. Analytical materials, reviews, and news articles by ink Advisory are intended solely to inform clients and do not constitute advertising of securities or other financial instruments. The information is based on public sources deemed reliable; however, ink Advisory does not guarantee its absolute accuracy and accepts no liability for possible inaccuracies or changes in the data.
Investing in securities involves risks and all investment decisions should be made independently by the investor, taking into account personal financial goals and acceptable risk levels. Even in the presence of positive assessments, conclusions should not be considered as investment recommendations. This material does not constitute an investment recommendation, offer or solicitation to buy or sell securities of MD Medical Group Investments (Mother and Child Group, MDMG) or the securities of any other companies. ink Advisory accepts no liability for any losses arising from the use of this material in making transactions or investment decisions.
Intellectual Property ProtectionThis article is protected by copyright. The exclusive rights to this article belong to ink Advisory. Quoting of the article is permitted in an amount not exceeding 30% of the original material, provided that the name of the Copyright Holder and the source are cited, along with an active hyperlink (for electronic resources) and the publication date of the original material. Any use of the article beyond quotation is allowed only with written permission from ink Advisory or with the attribution: «Exclusive rights to this material belong to ink Advisory».
Reproduction (full or partial) of materials beyond quotation for the purpose of commercialization is prohibited without the written consent of the Copyright Holder. This includes distribution, publication, adaptation or creation of derivative works, as well as use in mass media, analytical reports, or public presentations without proper source citation.
All materials, including analytical reviews, research reports, and news articles published on this resource, are the intellectual property of ink Advisory and are protected under the legislation of the Russian Federation. In case of violation of these conditions, the Copyright Holder reserves the right to seek protection of its rights.
More detailed information is provided in the User Agreement