In our “Active Growth Strategy: MD Medical Group Case” article we recently discussed three strategic growth pathways with varying capital structures: internal growth strategy, sustainable growth strategy, and active growth strategy. In this article, we take the next leap – using a financial model we illustrate how capital structure choices impact the pace of business expansion, future enterprise value, and founder’s returns.
Founders have differing interpretations of the role of external capital – and these assumptions shape their view of available growth strategies.
Some prioritize complete independence and therefore rely exclusively on internally generated funds, approaching debt with caution. Others perceive debt as the primary – if not the only – instrument for funding expansion. A third group sees equity investors as a strategic opportunity.
In reality, the choice of capital structure – the balance between equity and debt – defines the long-term growth rate of the company and its future value. Decisions in this area are often made intuitively, rather than analytically, even though the financial consequences of such choices are substantial.
To demonstrate this, we built a financial model showing how the same business evolves under different growth strategies over both the medium- and long-term horizons.
We took a hypothetical mid-sized private company and modelled its performance over a ten-year period across several scenarios, each corresponding to a specific growth strategy.
The underlying logic for costs, capacity utilization, and working capital remains consistent across strategies. However, the pace of scaling and operational performance differs depending on how the business expansion is financed.
As the company scales, its profitability, asset turnover, and infrastructure efficiency evolve. These effects manifest differently in each scenario – capital structure determines how quickly the company reaches the scale at which operating leverage begins to materialize.
We examined three fundamental strategies for a company operating in a growing market:
The financial model allows us to compare three growth scenarios –
The financial model captures the dynamics of key financial metrics, the rate of the investment program roll-out, cash-flow generation, and the overall financial stability of the company. This approach makes it possible to define the optimal balance between the speed of growth and financial stability in a growing market.
The analysis shows that
|
|
|
|
|
|
|
Financial Modelling Results
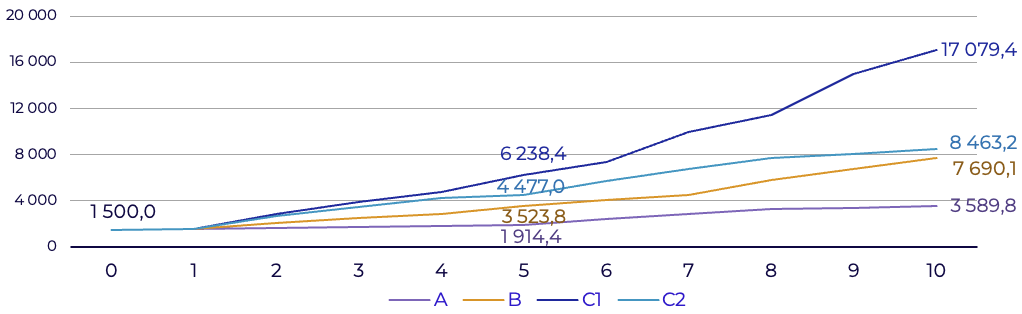
Our modelling demonstrates that, under identical operating parameters in a growing market, the difference in the speed of scaling becomes the primary driver of future financial performance. The more investment resources are available to the company in the early years, the faster it scales – and the higher is its ultimate enterprise value.
| Strategy A | Strategy B | Strategy C1 | Strategy C2 | ||||||
|---|---|---|---|---|---|---|---|---|---|
| Период | 0 | 10 | CAGR 0-10 |
10 | CAGR 0-10 |
10 | CAGR 0-10 |
10 | CAGR 0-10 |
| Revenues | 1 500,0 | 3 589,8 | 9,1% | 7 690,1 | 17,8% | 17 079,4 | 27,5% | 8 463,2 | 18,9% |
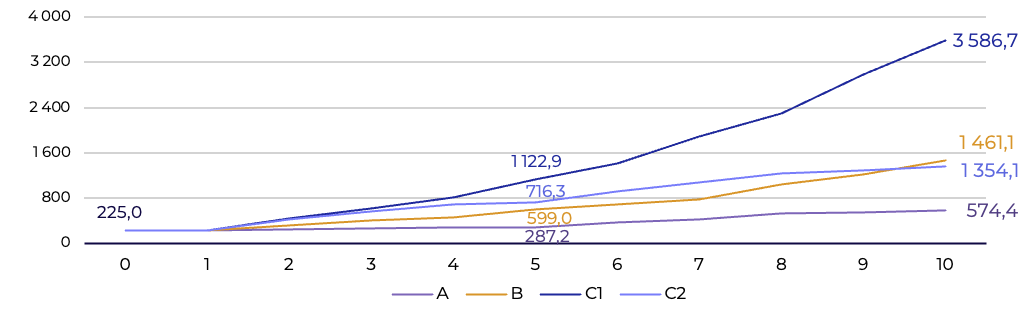
| EBITDA | 225,0 | 574,4 | 9,8% | 1 461,1 | 20,6% | 3 586,7 | 31,9% | 1 354,1 | 19,7% |
| EBITDA margin | 15,0% | 16,0% | - | 19,0% | - | 21,0% | - | 16,0% | - |
| Net Income | 109,8 | 369,0 | 12,9% | 756,2 | 21,3% | 1 589,6 | 30,6% | 263,9 | 9,2% |
| PPE | 757,9 | 1 178,4 | 4,5% | 3 257,4 | 15,7% | 9 229,3 | 28,4% | 2 868,6 | 14,2% |
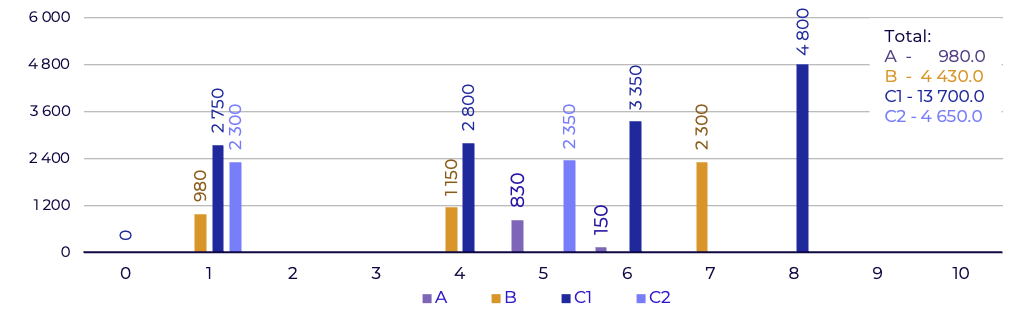
| Accumulated CapEx over 10 years | - | 980,0 | - | 4 430,0 | - | 13 700,0 | - | 4 650,0 | - |
| Equity (Book Value) | 979,4 | 2 615,0 | 10,3% | 3 345,2 | 13,1% | 7 090,1 | 21,9% | (221,5) | <0% |
| Debt | - | - | - | 752,0 | - | 3 350,0 | - | 3 576,0 | - |
The effect is particularly pronounced in the scenario with
This strategy enables the maximum increase in shareholder value (Equity Value) while maintaining financial stability. Although the founder’s ownership share is diluted, the value of that share increases multiple times due to accelerated business growth and a lower cost of capital (WACC).
The capital structure decision made by the founder at the starting point effectively determines the company’s long-term valuation trajectory. The impact of this choice

The financial model allows for a comparison of the three considered strategies under comparable conditions and illustrates the impact of capital structure on the pace of business scaling. Key assumptions:
| 1 |
The macroeconomic environment and capital markets are neutral to favorable (no extreme macroeconomic shocks present):
|
| 2 |
The company operates in a growing market, creating conditions for scaling and the pursuit of active growth strategy:
|
| 3 |
Company growth is driven by three key groups of factors. The logic is consistent across all strategies – differences lie in capital structure and the pace of business scaling:
|
|
Notes
In mature and highly competitive markets, expanding production capacity often fails to deliver the expected results: increased supply can lead to oversupply, declining prices, and reduced business profitability. Under these conditions, companies pursuing active growth can scale business not by adding new capacity, but through M&A – consolidating existing market players. |
The company funds investments gradually, using accumulated profits. This approach makes growth predictable and safe but limits the scale of the business – without external capital, it is impossible to fully capitalize on market opportunities, rapidly expand operations, and achieve economies of scale.
In the early stages, the strategy appears viable, but over time, the slower growth pace compared to other strategies becomes increasingly noticeable in a growing market.
This strategy allows for accelerated growth: the company becomes financially flexible, can invest more actively, and yet remain financially stable. Debt acts as a tool for scaling rather than a risk factor.
Often, the ability to raise debt within permissible limits may be constrained by lack of collaterals. In such cases, the company may need to consider bringing in an equity investor (
| Strategy A | Strategy B | ||||||||||
|---|---|---|---|---|---|---|---|---|---|---|---|
| Year | 0 | 3 | 5 | 7 | 10 | CAGR 0-10 |
3 | 5 | 7 | 10 | CAGR 0-10 |
| Revenues | 1 500,0 | 1 736,4 | 1 914,4 | 2 867,7 | 3 589,8 | 9,1% | 2 493,5 | 3 523,8 | 4 534,8 | 7 690,1 | 17,8% |
| EBITDA | 225,0 | 260,5 | 287,2 | 430,1 | 574,4 | 9,8% | 399,0 | 599,0 | 770,9 | 1 461,1 | 20,6% |
| EBITDA margin | 15,0% | 15,0% | 15,0% | 15,0% | 16,0% | 15,0% | 17,0% | 17,0% | 19,0% | ||
| Net income | 109,8 | 172,9 | 193,3 | 212,0 | 369,0 | 12,9% | 125,5 | 165,4 | 302,0 | 756,2 | 21,3% |
| PPE | 757,9 | 688,0 | 1 482,3 | 1 430,6 | 1 178,4 | 4,5% | 1 481,8 | 2 330,2 | 4 282,5 | 3 257,4 | 15,7% |
| Accumulated CapEx 1 | - | - | 830,0 | 980,0 | 980,0 | 980,0 | 2 130,0 | 4 430,0 | 4 430,0 | ||
| NWC 2 | 31,2 | 36,1 | 39,8 | 59,7 | 243,1 | 22,8% | 79,8 | 119,8 | 154,2 | 321,4 | 26,3% |
| Cash | 190,3 | 600,0 | 73,0 | 375,9 | 1 193,5 | 20,2% | 99,6 | 124,9 | 9,0 | 518,3 | 10,5% |
| Equity (Book Value) | 979,4 | 1 324,1 | 1 595,0 | 1 866,2 | 2 615,0 | 10,3% | 1 235,8 | 1 551,2 | 2 129,8 | 3 345,2 | 13,1% |
| Debt | - | - | - | - | - | - | 425,4 | 1 023,8 | 2 316,0 | 752,0 | - |
| Debt/EBITDA | - | - | - | - | - | 1,1(x) | 1,7(x) | 3,0(x) | 0,5(x) | ||
| Debt/Equity | - | - | - | - | - | 0,3(x) | 0,7(x) | 1,1(x) | 0,2(x) | ||
| Valuation | |||||||||||
| Forward EV/EBITDA | 6,7(x) | 7,3(x) | 6,5(x) | 8,0(x) | 10,0(x) | 15,0(x) | 13,6(x) | 10,3(x) | 10,8(x) | ||
| Enterprise Value | 1 575,0 | 1 996,8 | 2 392,1 | 4 179,1 | 5 724,3 | 13,8% | 6 864,3 | 9 363,1 | 10 734,8 | 15 793,9 | 25,9% |
| Equity Value (EqV) | 1 765,3 | 2 596,8 | 2 465,1 | 4 555,5 | 6 917,8 | 14,6% | 6 538,5 | 8 464,2 | 8 427,8 | 15 560,3 | 24,3% |
| EqV Founder Stake | 1 765,3 | 2 596,8 | 2 465,1 | 4 555,5 | 6 917,8 | 14,6% | 6 538,5 | 8 464,2 | 8 427,8 | 15 560,3 | 24,3% |
| IRR Founder | 9,1% | 16,4% | 36,8% | 24,6% | |||||||
| WACC | 18,9% | 14,9% | 12,9% | 12,9% | 12,9% | 14,9% | 12,5% | 12,4% | 12,7% | ||
| ROIC | 11,9% | 11,3% | 10,8% | 11,6% | 13,6% | 10,8% | 9,7% | 12,0% | 20,5% | ||
| EP Spread | -7,0% | -3,6% | -2,1% | -1,3% | 0,7% | -4,1% | -2,8% | -0,3% | 7,8% | ||
By the end of Year 10, the company’s Equity Value in
| a. Growth rate and potential | |
|
Under
Consequently, only a single investment phase totalling |
The company raises debt to finance the strategy until the Debt/EBITDA ratio reaches 3.0x. As a result, the company can fund three investment phases totalling
|
| b. Equity Value | |
|
The monetary value of equity, estimated using the DCF approach at the end of Year 10, will amount to
|
Monetary value of Equity Value using the DCF approach at the end of Year 10 will amount to
|
| c. Founder returns over the period (IRR) | |
|
Returns are limited to
|
Founder achieves an average annual return of approximately
|
| d. Key Takeaways for the Founder | |
|
|
|
Active Growth Strategy (C) uses the idea of raising capital from multiple sources – a combination of equity and debt financing. Unlike Strategy A and Strategy B, business scales significantly faster, as it is not constrained by internal resources or the pace of profit accumulation.
By flexibly using external financing, the company can execute larger investment programs on a regular basis and grow at rates comparable to – or even exceeding – market growth.
The investor may contribute not only capital but also industry expertise.
This approach is fairly common, particularly when companies receive subsidized loans. That is why we included this alternative scenario in our analysis. The founder retains full control of the company but assumes all risks associated with debt financing.
Initially, the strategy may appear attractive, especially if subsidized loans are used: business grows rapidly. However, high leverage (Debt/EBITDA above 4.0x) significantly undermines financial stability, makes the business dependent on creditors, limits operational flexibility, and complicates further investments.
Any slowdown in sales or increase in interest rates can put business in jeopardy. This option is the riskiest and least promising for the founder, as it does not create value and can result in the loss of capital.
| Parameter | Strategy С1: Equity and Debt financed Growth | Strategy С2: Growth financed with Debt only |
|---|---|---|
| Leverage level | Moderate | Maximum |
| Cost of debt | Moderate | Significant |
| Debt covenants | Flexible | Strict |
| Availability of long term loans | Yes | No, only short term |
| Capacity to scale further | High | Limited |
| Dividends | Higher | None or limited by covenants |
| Founder share dilution | Maximum | None |
| WACC | Minimal | Maximum (Distressed Asset) |
| Founder IRR | Maximum | Negative or minimal (capital loss) |
Most company owners prefer the strategies they understand best – internal or sustainable growth –and, if they consider active growth strategy, they tend to rely on debt financing they are familiar with.
As a result, they either dismiss the active growth strategy entirely or overlook the option involving equity. This is often due to a lack of understanding of many underlying processes. Below is a list of common misconceptions that limit the growth potential business.
| № | Misunderstandings and Fears About Raising Equity | Reality |
|---|---|---|
1 |
Assumption that internal resources and bank loans are sufficient for business growth
|
|
2 |
Fear of ownership share dilution
|
|
3 |
Concerns that investors will undervalue the company
|
|
4 |
Risk avoidance: preference for the status quo and reluctance to explore new markets or products
|
|
5 |
Short-term thinking: focus on current dividends over company growth
|
|
6 |
Belief that business growth will be hampered by the need to coordinate all decisions with investors and the potential that investors may act in bad faith
|
|
The financing structure in active growth strategy predetermines not only the company’s financial stability but also its operational potential.
With moderate leverage (
Comfortable debt repayments in
In contrast, if active growth relies solely on debt financing (
High operational efficiency cannot offset the effects of excessive debt – debt servicing becomes the key factor determining company stability.
In
Even if the company navigates financial turbulence successfully, its equity value will remain lower than under
Thus, an “aggressive growth at any cost” approach funded entirely by debt is unjustified and will erode shareholder value in the coming years.
| Strategy C1 | Strategy C2 | ||||||||||
|---|---|---|---|---|---|---|---|---|---|---|---|
| Period | 0 | 3 | 5 | 7 | 10 | CAGR 0-10 |
3 | 5 | 7 | 10 | CAGR 0-10 |
| Revenues | 1 500,0 | 3 860,8 | 6 238,4 | 9 967,4 | 17 079,4 | 27,5% | 3 513,2 | 4 477,0 | 6 751,3 | 8 463,2 | 18,9% |
| EBITDA | 225,0 | 617,7 | 1 122,9 | 1 893,8 | 3 586,7 | 31,9% | 562,1 | 716,3 | 1 080,2 | 1 354,1 | 19,7% |
| EBITDA margin | 15,0% | 16,0% | 18,0% | 19,0% | 21,0% | 562,1 | 716,3 | 1 080,2 | 1 354,1 | 19,7% | |
| Net income | 109,8 | 176,9 | 259,0 | 524,4 | 1 589,6 | 30,6% | (261,5) | (171,5) | (199,2) | 263,9 | 9,2% |
| PPE | 757,9 | 2 915,5 | 4 976,5 | 7 141,0 | 9 229,3 | 28,4% | 2 551,0 | 4 511,3 | 3 749,1 | 2 868,6 | 14,2% |
| Accumulated CapEx 1 | - | 2 750 | 5 550,0 | 8 900,0 | 13 700,0 | 2 300,0 | 4 650,0 | 4 650,0 | 4 650,0 | ||
| NWC 2 | 31,2 | 123,5 | 224,6 | 378,8 | 654,1 | 35,6% | 171,4 | 256,1 | 386,2 | 484,1 | 31,5% |
| Cash | 190,3 | 382,8 | 149,2 | 171,7 | 556,7 | 11,3% | 14,8 | 6,8 | 12,2 | 1,8 | -37,4% |
| Equity (Book Value) | 979,4 | 3 001,8 | 3 530,3 | 4 491,4 | 7 090,1 | 21,9% | 212,2 | (29,9) | (629,5) | (221,5) | - |
| Debt | - | 420,0 | 1 820,0 | 3 200,0 | 3 350,0 | - | 2 525,0 | 4 804,0 | 4 777,0 | 3 576,0 | - |
| Debt/EBITDA | - | 0,7(x) | 1,6(x) | 1,7(x) | 0,9(x) | 4,5(x) | 6,7(x) | 4,4(x) | 2,6(x) | ||
| Debt/Equity | - | 0,1(x) | 0,5(x) | 0,7(x) | 0,5(x) | 11,9(x) | (160,9) | (7,6) | (16,1) | ||
| Valuation | |||||||||||
| Forward EV/EBITDA | 6,7(x) | 19,8(x) | 15,9(x) | 12,9(x) | 11,5(x) | 1,4(x) | 0,3(x) | 2,7(x) | 2,8(x) | ||
| Enterprise Value | 1 575,0 | 15 930,3 | 22 289,8 | 29 652,4 | 41 239,7 | 38,6% | 940,7 | 273,0 | 3 272,9 | 3 836,9 | 9,3% |
| Equity Value (EqV) | 1 765,3 | 15 893,1 | 20 619,0 | 26 624,1 | 38 446,3 | 36,1% | (1 569,5) | (4 524,2) | (1 492,0) | 267,7 | -17,3% |
| EqV Founder Stake | 1 765,3 | 7 969,8 | 10 339,7 | 13 351,0 | 19 279,4 | 27,0% | (1 569,5) | (4 524,2) | (1 492,0) | 267,7 | -17,3% |
| IRR Founder | 42,4% | 27,3% | < 0% | -17,3% | |||||||
| WACC | 18,9% | 14,9% | 12,6% | 12,5% | 12,6% | 20,4% | 42,5% | 42,5% | 41,7% | ||
| ROIC | 11,9% | 6,6% | 7,8% | 10,5% | 18,1% | 7,5% | 9,8% | 11,7% | 22,5% | ||
| EP Spread | -7,0% | -8,3% | -4,7% | -2,0% | 5,5% | -12,9% | -32,7% | -30,8% | -19,2% | ||
| Ownership structure | 100,0% | 100,0% | 100,0% | 100,0% | 100,0% | 100,0% | 100,0% | 100,0% | 100,0% | ||
| Founder | 100,0% | 50,1% | 50,1% | 50,1% | 50,1% | 100,0% | 100,0% | 100,0% | 100,0% | ||
| Investors | 0,0% | 49,9% | 49,9% | 49,9% | 49,9% | 0,0% | 0,0% | 0,0% | 0,0% | ||
| Strategy C1 – Equity and Debt Financing | Strategy C2 – Debt-Only Financing |
|---|---|
| a. Growth rate and Company’s potential | |
|
Under |
Under
In this scenario, any decline in operational efficiency can result in loss of control over the company.
|
| b. Equity Value | |
The DCF-based Equity Value by Year 10 reaches |
Under
Excessive debt undermines the equity value – shareholder capital approaches zero due to default risk, with creditors potentially demanding debt conversion or a change in control. |
| c. Founder’s IRR | |
|
Founders’ IRR is maximized at
|
The founder can lose equity value because:
IRR can turn negative as cash flows go to creditors, leading to loss of financial stability, value, and control
|
| d. Key Takeaways for the Founder | |
|
In the long run
|
Pursuing active growth through excessive leverage in
|
A growth strategy works only when followed by disciplined execution: capital management discipline, a transparent financial model, control over the investment program, and the ability to adapt quickly to market conditions.
To translate a chosen strategy into measurable results, the company must move from intuition-driven decisions to data-driven decision-making.
Other key findings of our research:
Long-term plans and financial models are always built on assumptions that lose relevance over time. Therefore, a critical element of management is the regular review and adjustment of plans and financial forecasts in response to external changes. This mechanism allows the company to revise decisions in a timely manner, adapt its strategy, and maintain a balance between emerging opportunities and new risks.
Regular planning, data-based decision-making, and discipline in these areas provide predictability and control over business.
Financial modelling is a critical tool for adjusting the balance between debt and equity, maintaining the optimal trade-off between growth speed and financial stability.
Our value to your business: