На любом зрелом рынке одновременно есть растущие игроки и компании в инертном состоянии. Одни наращивают продажи и операционную эффективность, другие – довольствуются сохранением уровня продаж и прибыли. Однако в условиях сдвигов в потребительском поведении, роста стоимости капитала и инфляционного давления, стратегическая пассивность становится особенно опасной: она напрямую влияет на способность компании сохранять или создавать акционерную стоимость.
В этом контексте интересно рассмотреть сравнительный кейс двух игроков на рынке молочной продукции.
Обе компании производят молочную продукцию, находятся в разных областях Центрального федерального округа недалеко от г. Москвы, их продуктовые линейки полностью совпадают, и по итогам 2020 г. имели сопоставимые размеры бизнеса. Эти компании выбраны для рассмотрения по причине схожести бизнеса и идентичности рынка – другими словами, различия в траекториях развития этих компаний после 2020 г. объясняются во многом разными подходами к стратегии развития.

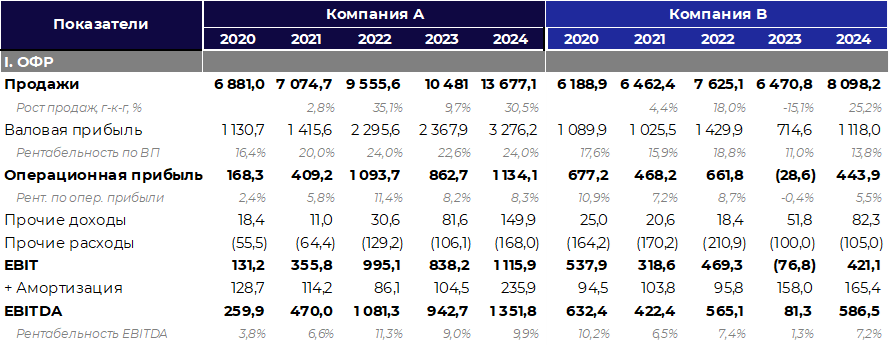
Это свидетельствует о наличии ясной стратегии масштабирования в Компании A и работе собственников и топ-менеджмента над операционной эффективностью.
Такая динамика финансовых показателей Компании B косвенно указывает либо на отсутствие стратегии роста, либо на низкую эффективность в ее реализации.
ROIC
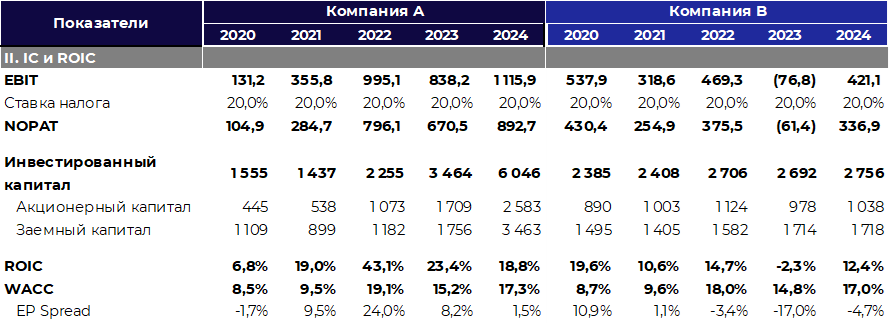
Такие показатели отражают способность Компании A эффективно управлять вложенным капиталом и последовательно увеличивать свою акционерную стоимость.
У
Подобная динамика показателей ROIC и WACC показывает, что Компания B теряет акционерную стоимость, а доходность ее владельцев – отрицательная.

Владельцы
В результате, к концу 2024 г. акционерная стоимость (EqV)
Ситуация с Компанией B представляет собой пример упущенной возможности по выходу ее владельцев из бизнеса на пике стоимости. Бизнес целесообразно продавать в момент максимальной рентабельности, пока мультипликаторы позволяют получить максимальную стоимость для его владельцев. Если компания активно не растет, то с этого момента начинается снижение эффективности, рентабельности и, как следствие, мультипликаторов.


Это результат системной работы над стратегией, которая привела к росту EBITDA и росту рентабельности капитала.
Снижение ROIC относительно WACC, вызванное отсутствием стратегией активного роста, привело к разрушению акционерной стоимости.
Данная статья защищена авторским правом. Исключительные права на данную статью принадлежат ink Advisory. Цитирование статьи допускается при условии указания автора(-ов) и источника заимствования. Любое использование статьи за пределами цитирования допускается при наличии письменного разрешения ink Advisory или при указании оговорки «Исключительное право на материал принадлежит ink Advisory».